Unleashing Efficiency: A Look at Chrome DevTools' Latest Enhancements
Chrome DevTools stands as a cornerstone for web developers, streamlining the development process. However, staying abreast of its evolving features is crucial to maximizing productivity. This article delves into the most exciting additions to Chrome DevTools, empowering you to tackle your next project with greater efficiency.
Leveraging AI for Streamlined Debugging
The burgeoning influence of AI extends to the developer realm, and Chrome DevTools embraces this trend. Introducing Gemini AI integration directly within the browser console! Simply hover over an error message, and an "Understand this error" button emerges.
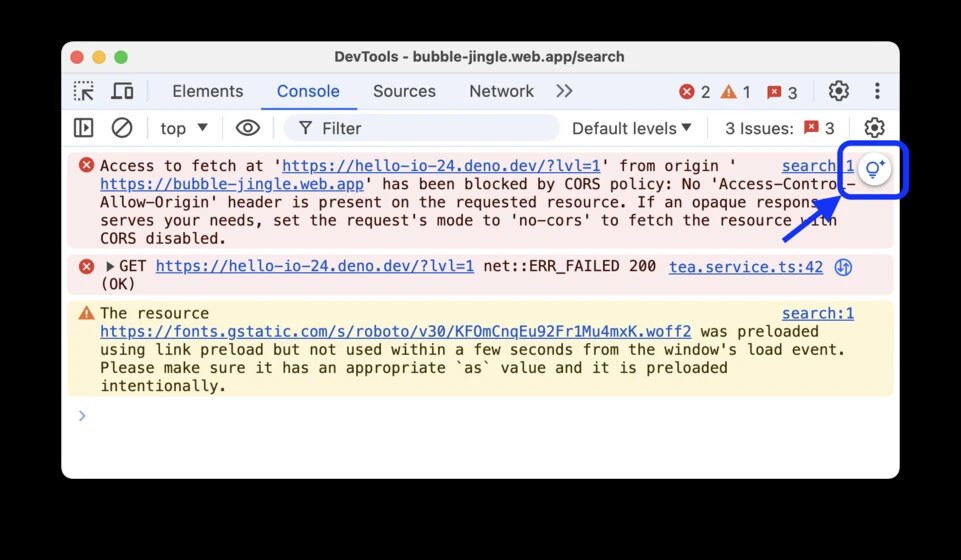
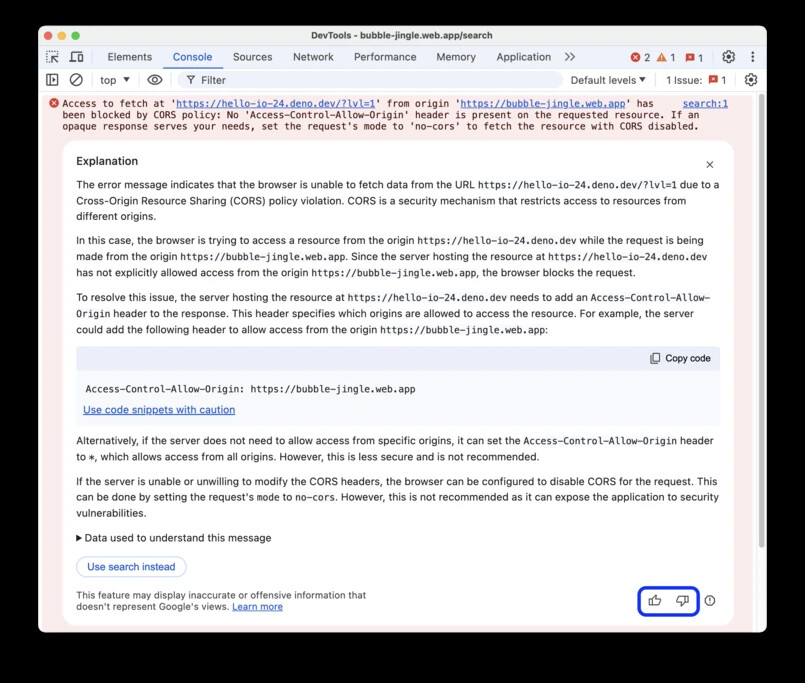
Error message in the DevTools console
Upon first use, a brief privacy and legal notice awaits your acknowledgment. Within seconds, a comprehensive explanation surfaces beneath the error, illuminating the issue. If the explanation falls short, click "Use search" to explore relevant results in a new tab. Additionally, you can provide feedback to further refine the AI's capabilities.
Conquering Elusive Elements with Page Focus Emulation
The struggle is real: pinpointing a specific element for inspection, only to have it vanish upon clicking the inspect button. Traditionally, developers resorted to workarounds – triggering elements, manipulating JavaScript, or setting breakpoints.
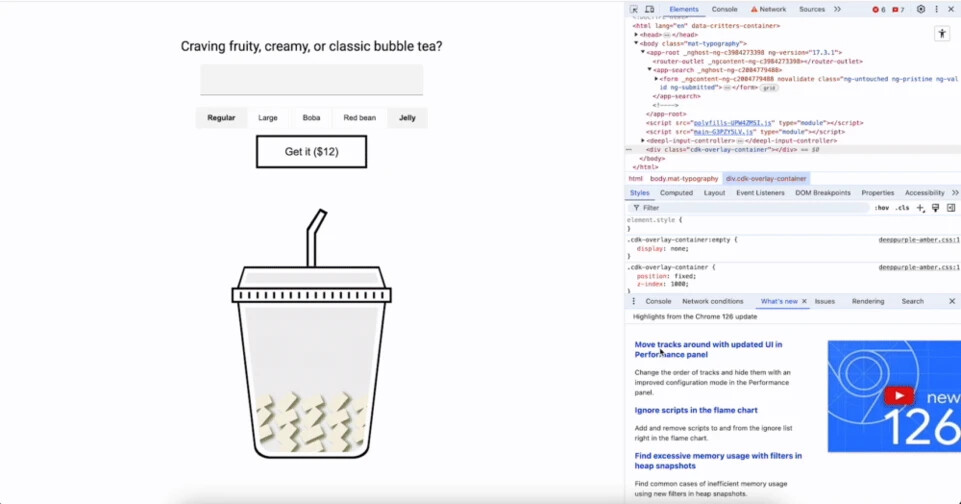
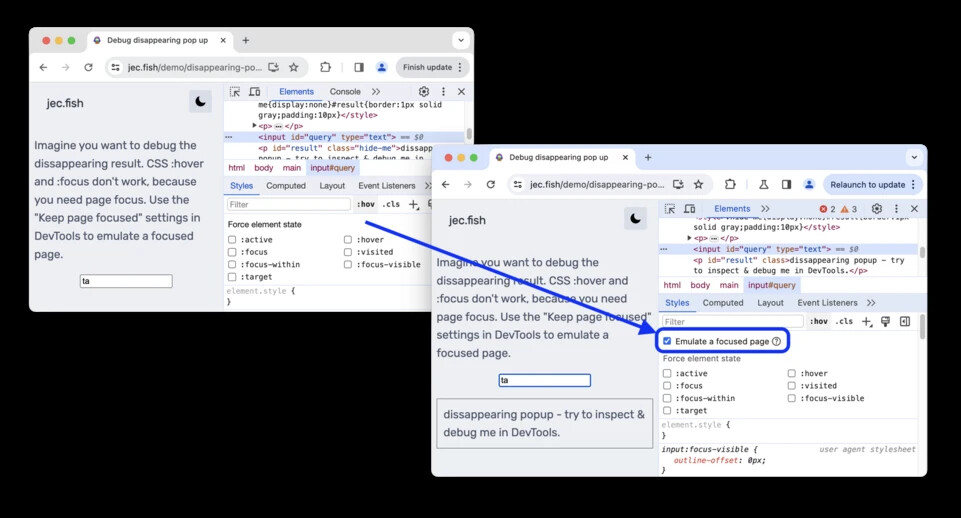
Focus-emulation activation
Introducing page focus emulation, a revolutionary feature that eliminates this frustration! By enabling the corresponding flag under the ":hov" button, you gain the power to seamlessly inspect any element, regardless of its dynamic behavior.
Facilitating Development with HTTP Response Mocking
REST APIs, the backbone of modern web applications, involve client applications sending requests with parameters and receiving responses containing crucial data. However, frontend development can stall when the backend is still under construction. Traditionally, developers faced the hurdle of acquiring the necessary API responses to progress.
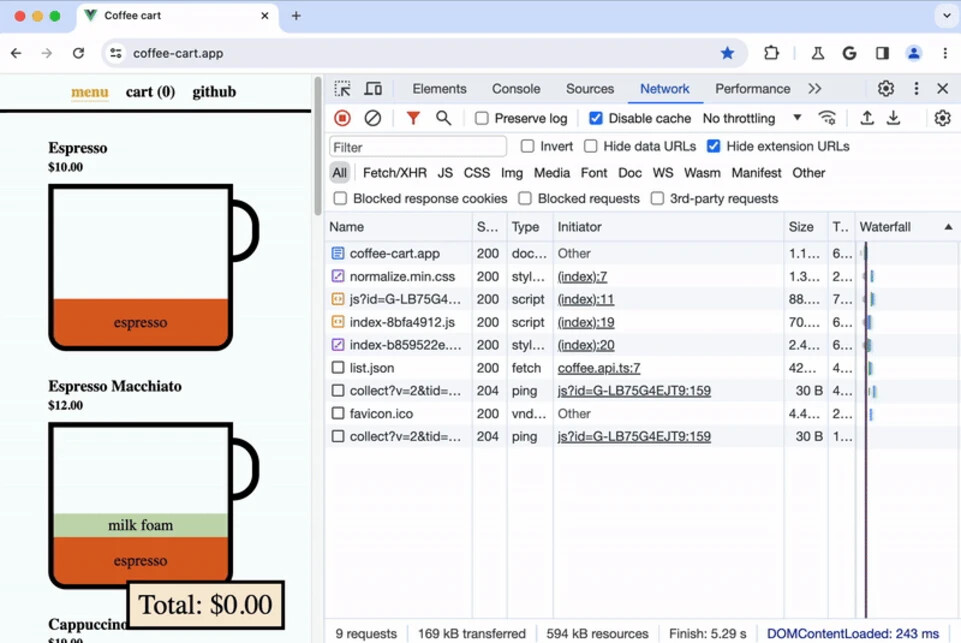
This is where Chrome DevTools' HTTP response mocking shines. Utilize local overrides to bypass roadblocks by prototyping and testing changes without relying on the backend, third-party services, or API updates. Mock responses to requests, headers, and various file types, empowering you to work independently and preserve your modifications across page reloads.
To mock responses for XHR requests, navigate to the Network tab, locate the desired request, right-click, and select "Override content."
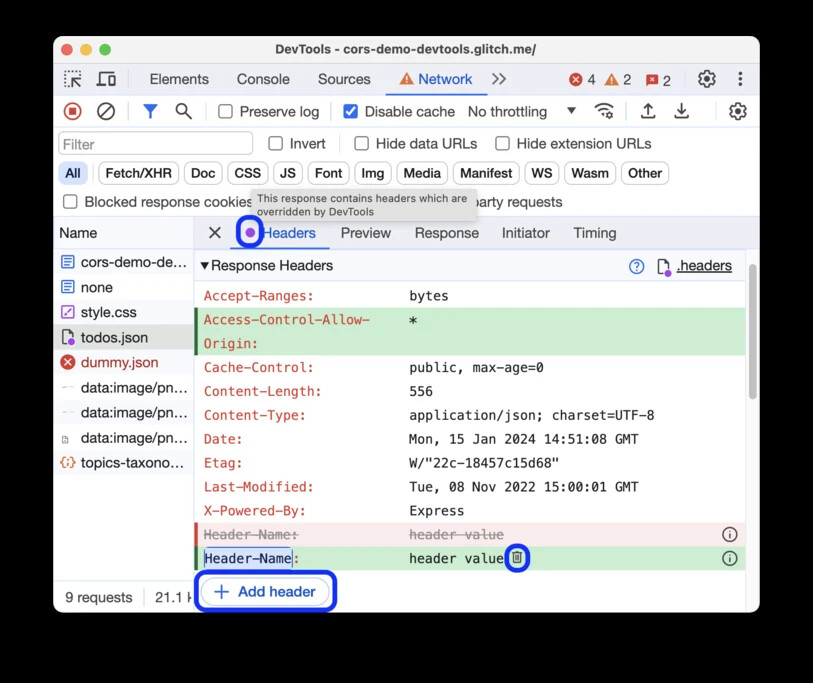
Headers overschrijven
Furthermore, the Network panel enables overriding HTTP response headers without server access. Prototype header-related fixes by right-clicking on a request and selecting "Override headers." DevTools guides you to the Headers > Response Headers editor, where you can tailor the headers to your needs.
By incorporating these innovative features into your workflow, you unlock a world of enhanced efficiency and streamlined development within Chrome DevTools.

Luc Kitslaar | Digital consultant
As a digital consultant, I have been supporting clients for many years in translating processes into simple, user-friendly digital solutions without unnecessary complexity.


